Student survey reveals negative views of Arch
A survey conducted by the Student Senate showed that 78 percent of respondents were unsatisfied with the Arch after they participated in it. 94 percent of respondents thought that students should be able to live in off-campus housing during the Arch. 64 percent of respondents said they would not participate in the Arch if it were optional.
The Arch Task Force of the Student Senate conducted the survey about the Arch in August. There were 196 people that responded, with 182 of them having participated in the Arch. The results of this survey were presented by Arch Task Force Chairperson Peter Gramenides ’20 in a closed meeting of the Senate in October.
There were 38 questions on the survey; 32 utilized a pre-determined answer (either a rating or one-word response), and five were open-ended questions.
Gramenides and Grand Marshal Meagan Lettko ’20 said responses were “vulgar,” which contributed to the decision to close the meeting. Gramenides was also concerned that identifying information would be revealed in the open-ended responses, and he didn’t want students to face “retaliation” based on their Arch-related opinions. The surveys were anonymous.
Due to the closed nature of the meeting, it is unknown what the Senate discussed. Gramenides gave a presentation to the Senate, and provided the slides he had presented to The Polytechnic.
The slides highlighted many of the results: a pie chart of student preferences on class length, the average answers to the Likert-type scale questions, a bar chart of how many new people students met, and quotes from the long-form student complaints and suggestions. It then gave suggestions on a variety of topics. The full presentation can be seen here.
Survey results
The results, compiled by The Polytechnic, can be seen below.
In the following waffle charts, each square represents a person. The questions preceding the charts are verbatim from the Arch Task Force’s survey.

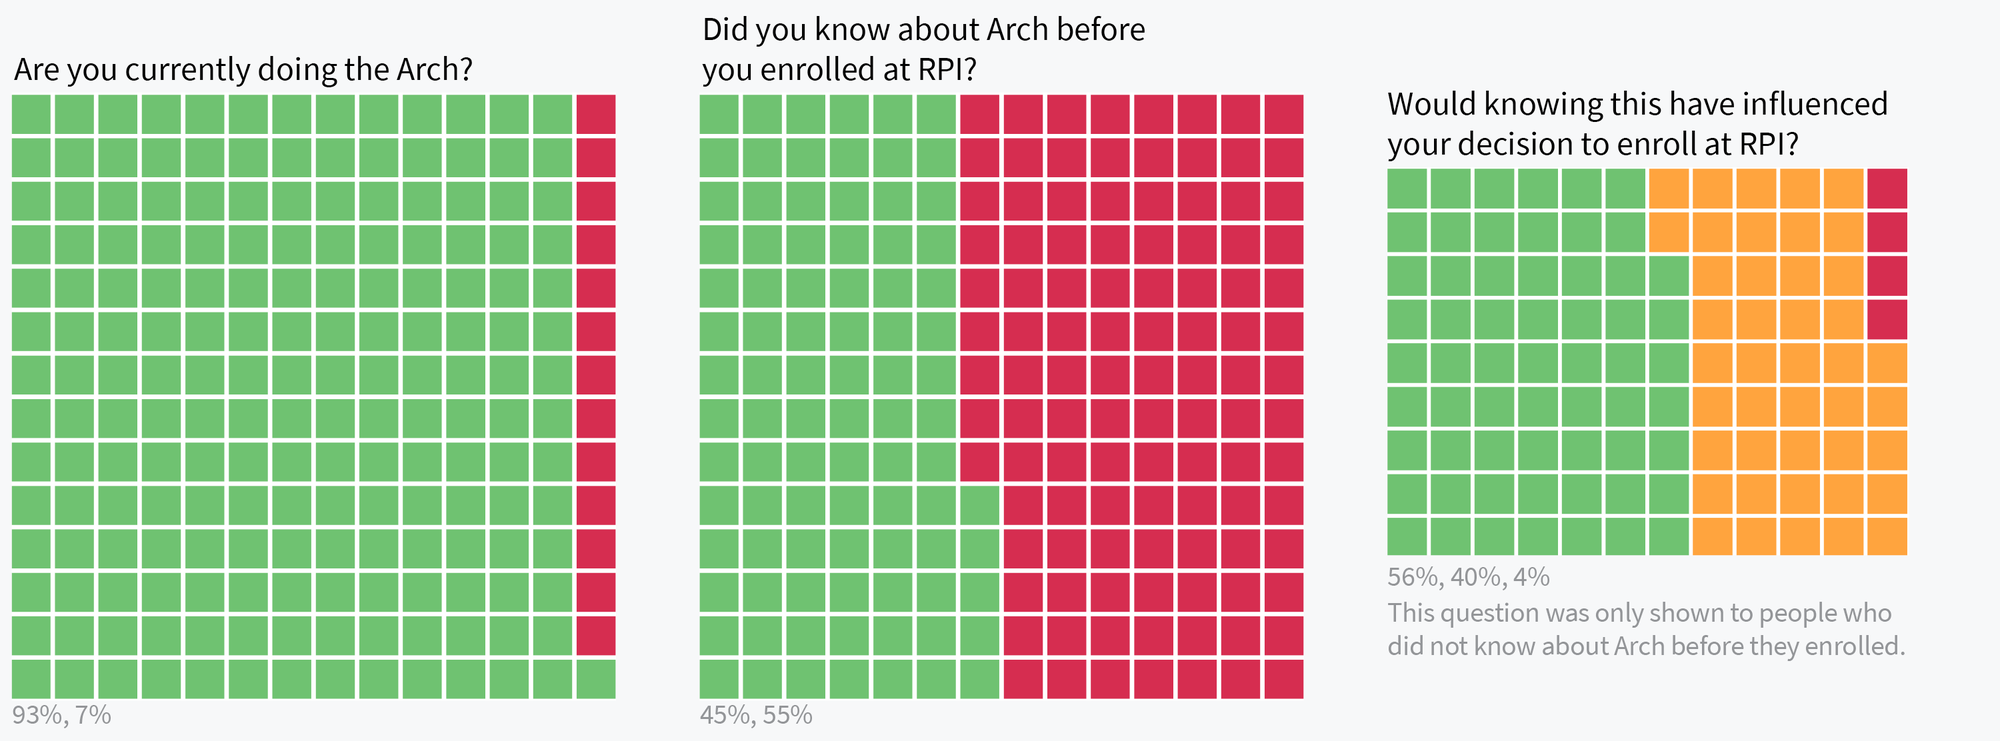
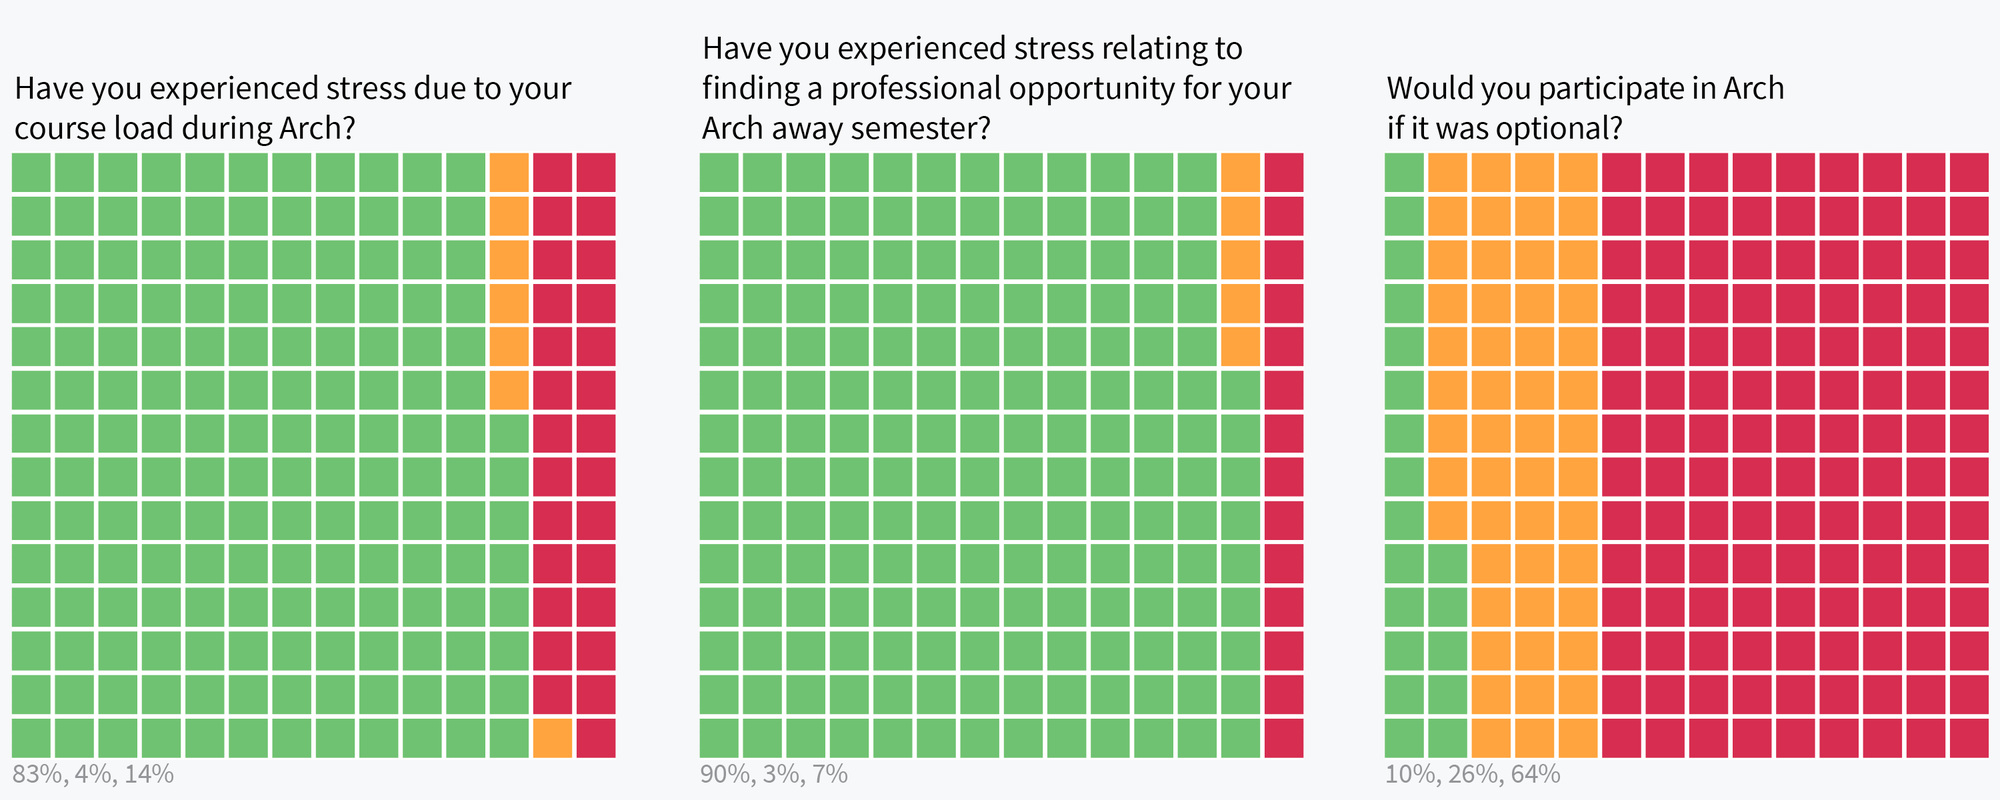
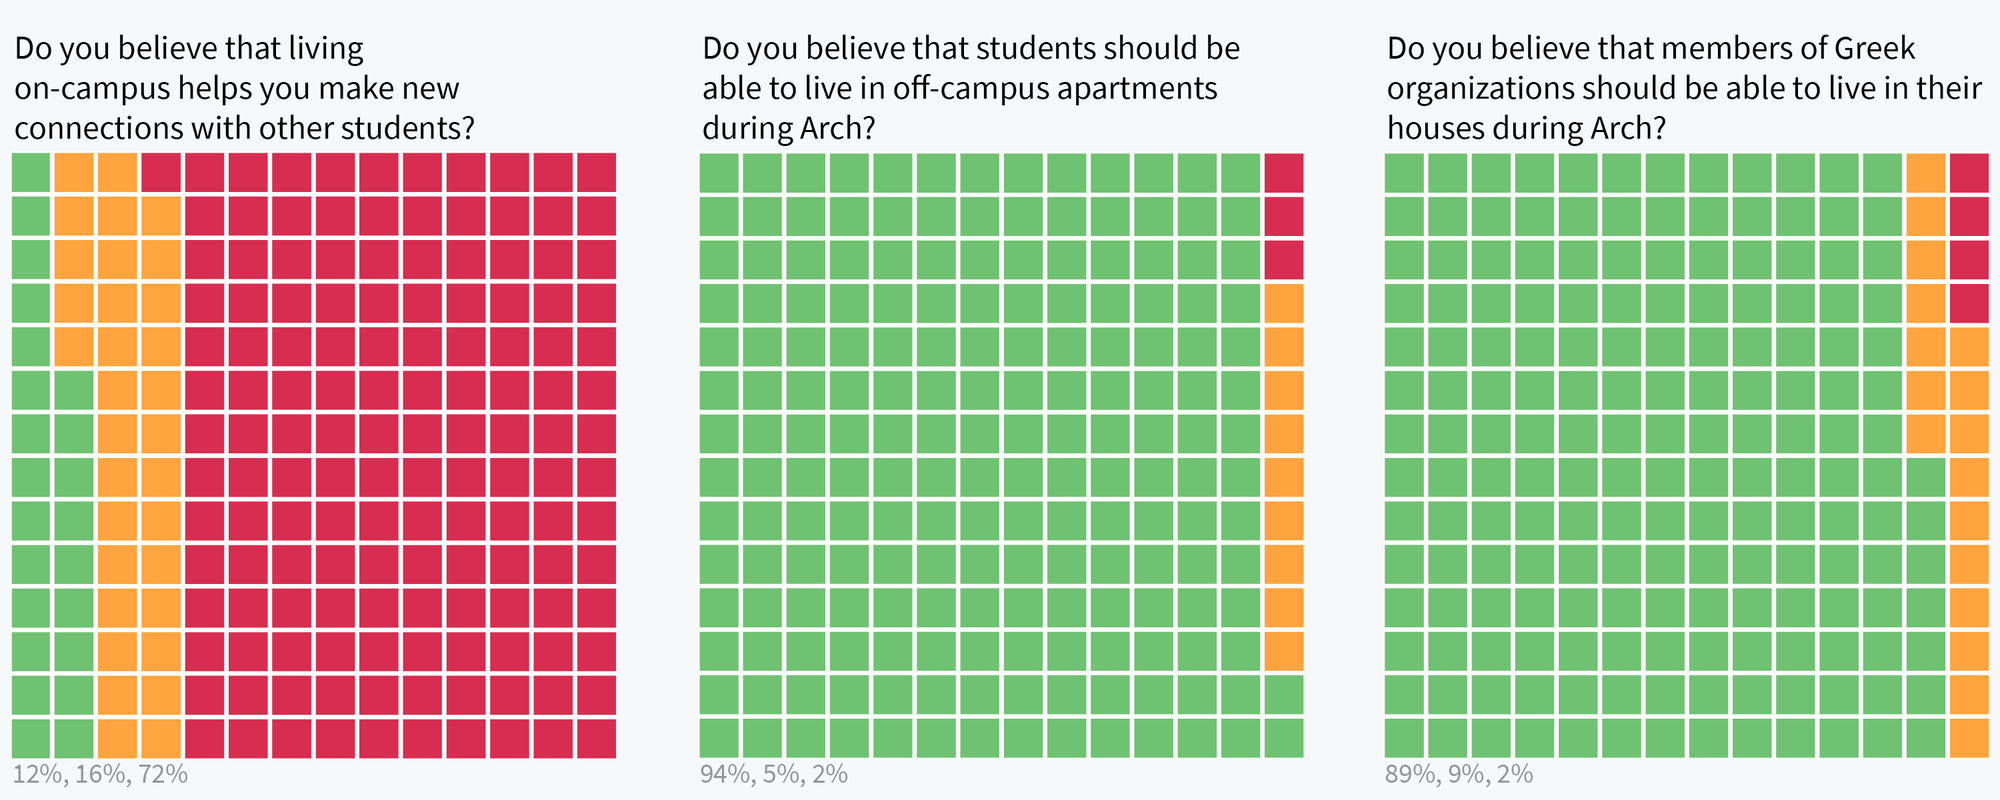
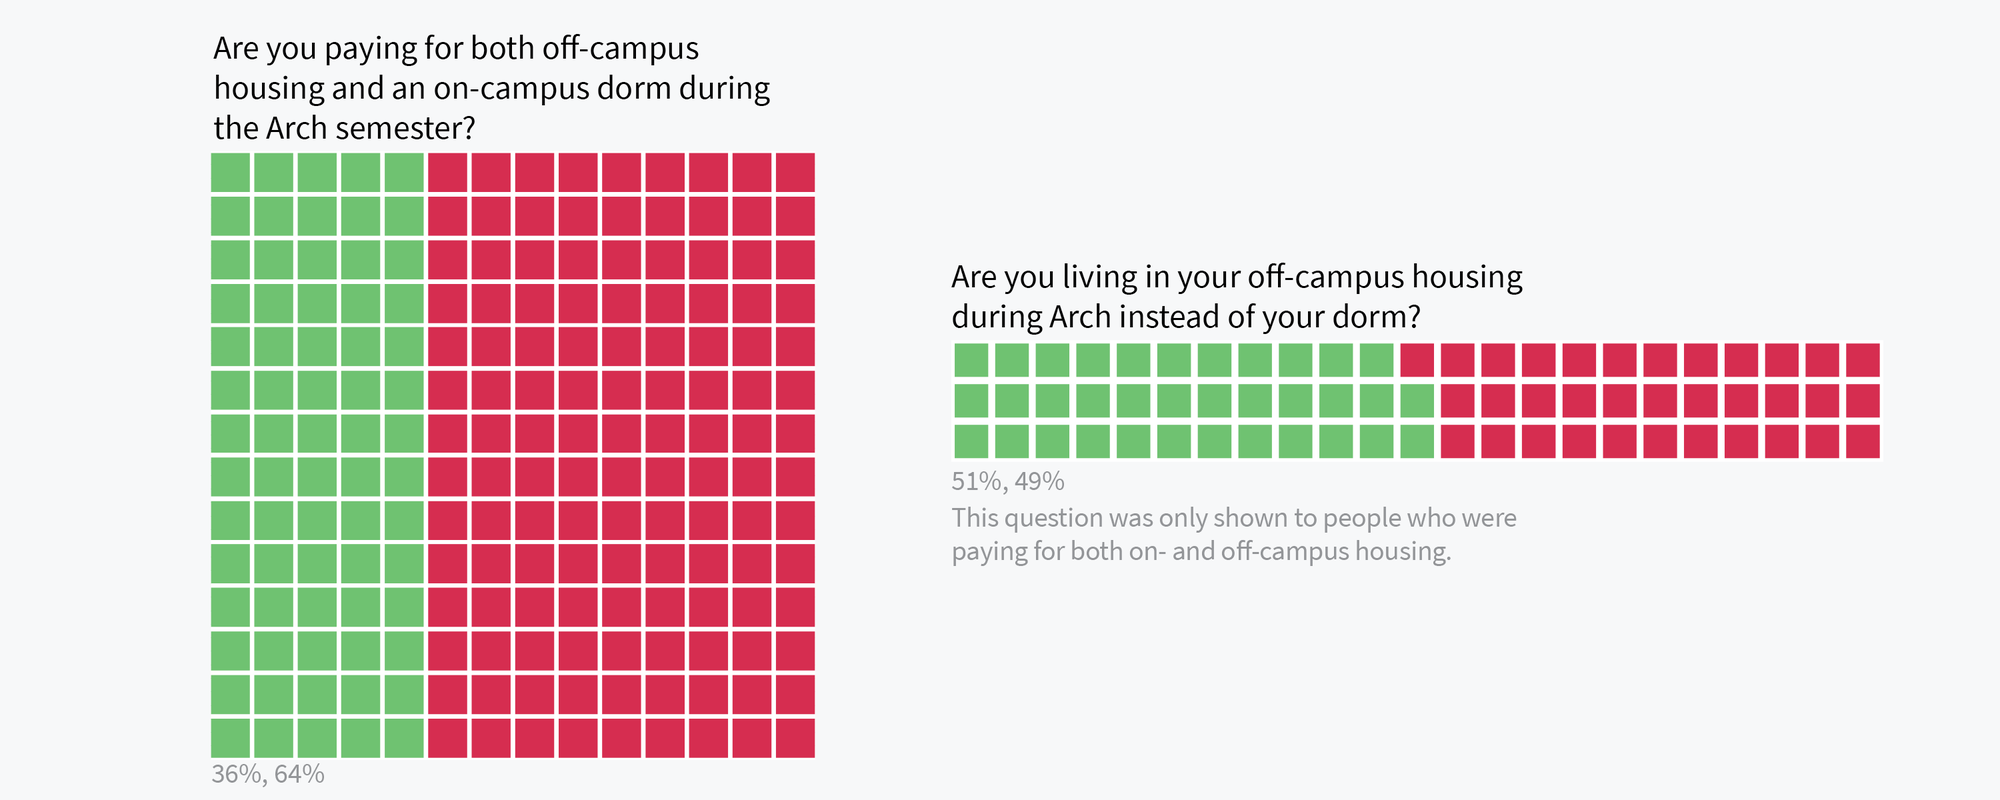


Students were asked to rank their satisfaction with some aspects of the Arch on a scale of one to five, with “five being most satisfied.”
In the following charts, the statements on the left are abbreviated from the Arch Task Force’s survey. For example, the phrase “During Arch” was distilled from the following in the survey: “On a scale from 1-5, five being most satisfied, please rate your satisfaction during Arch.”
The percentages—rounded to the nearest percentage—underneath the words correspond to the respective rankings. For example, when ranking their satisfaction during the Arch, 45 percent of respondents gave a one, 24 percent gave a two, 21 percent gave a three, 8 percent gave a four, and 1 percent gave a five.

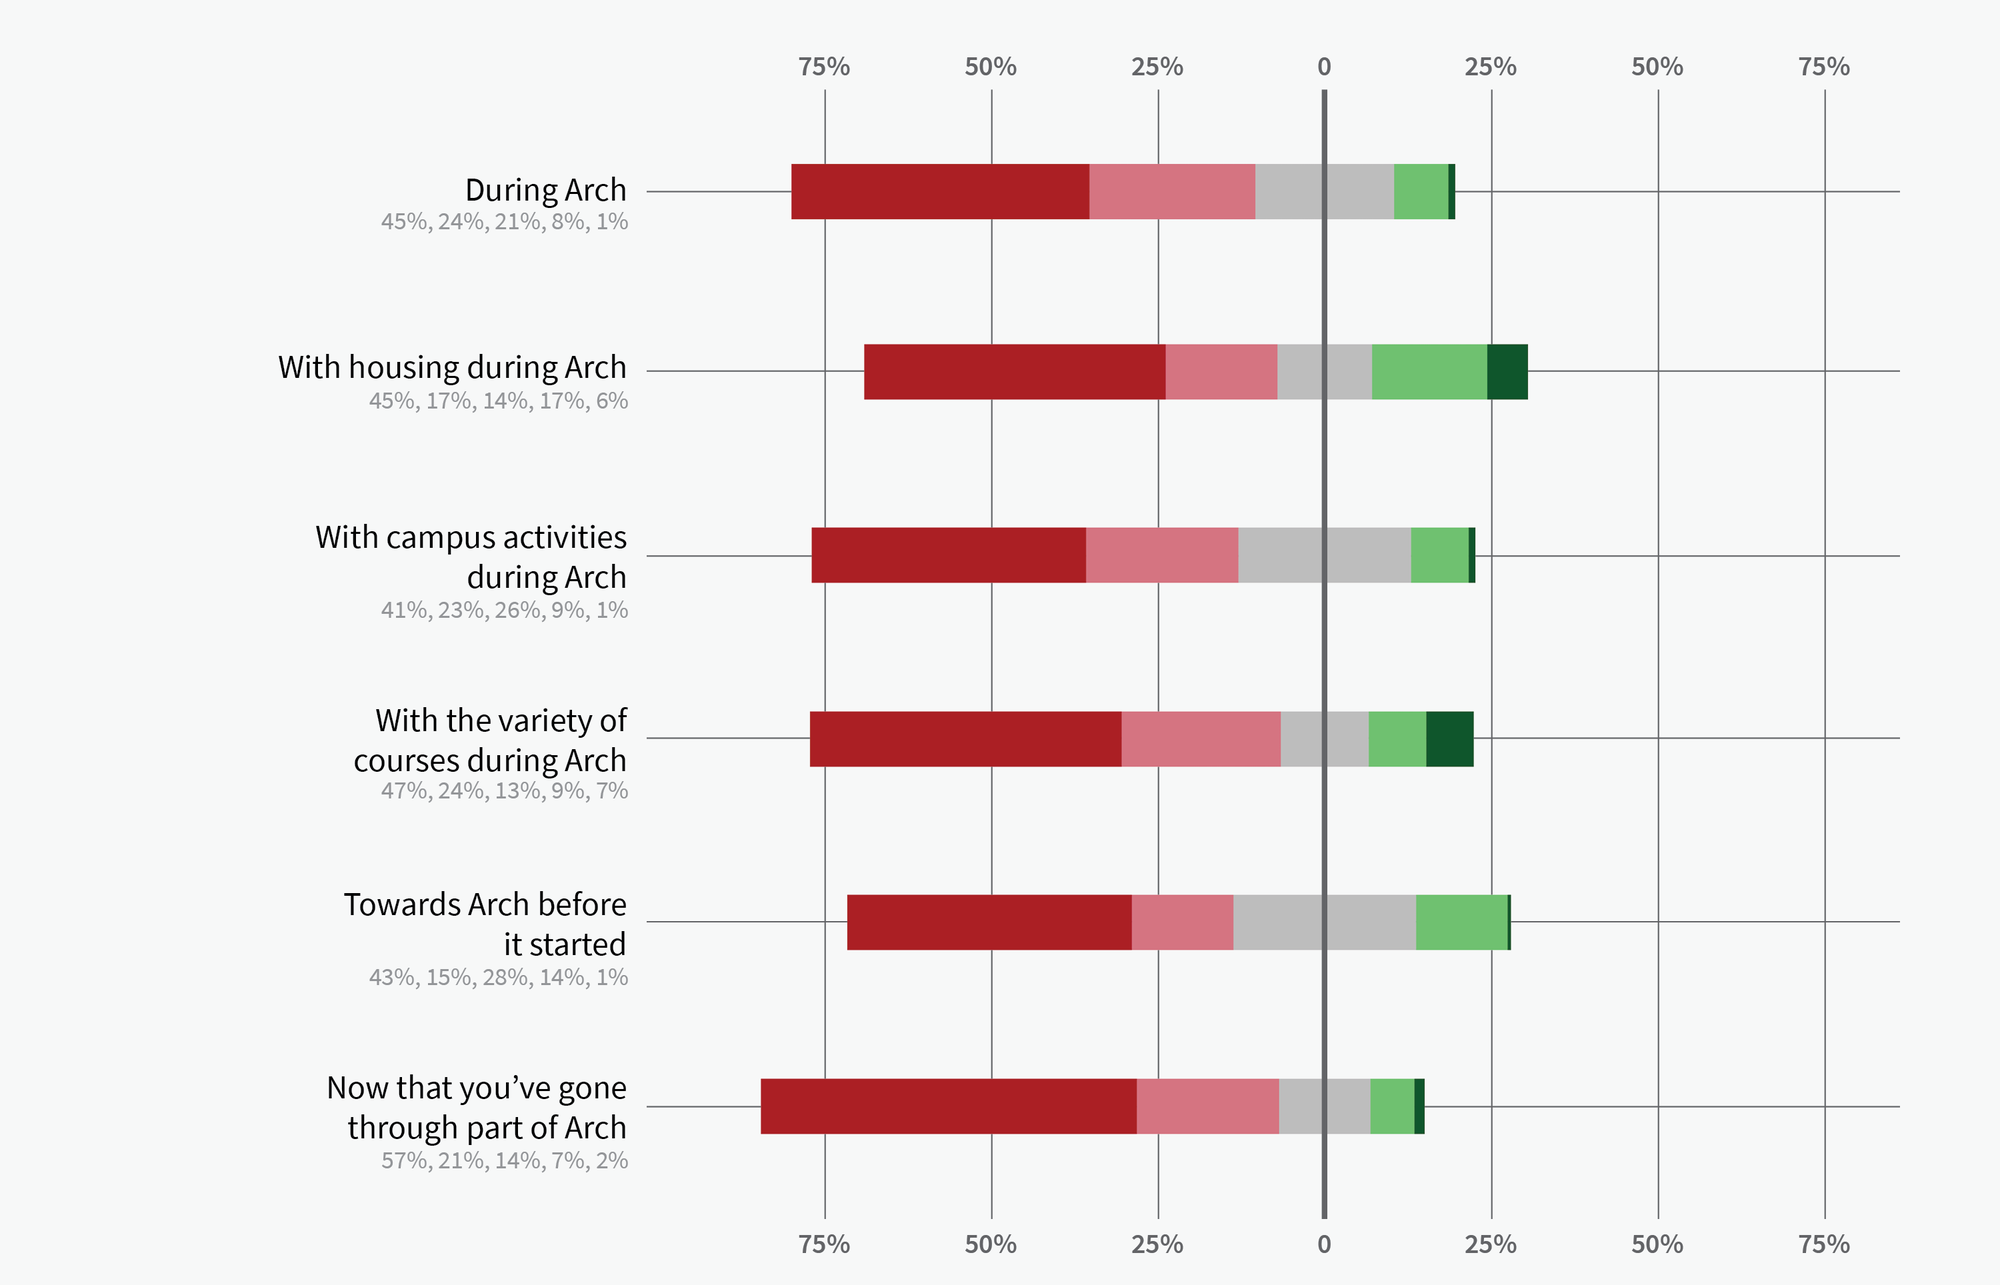
In the following charts, the statements on the left are verbatim from the Arch Task Force’s survey. Students were asked to pick a number from one to five that indicated how they felt about the statement, with one being “strongly disagree” and five being “strongly agree.”

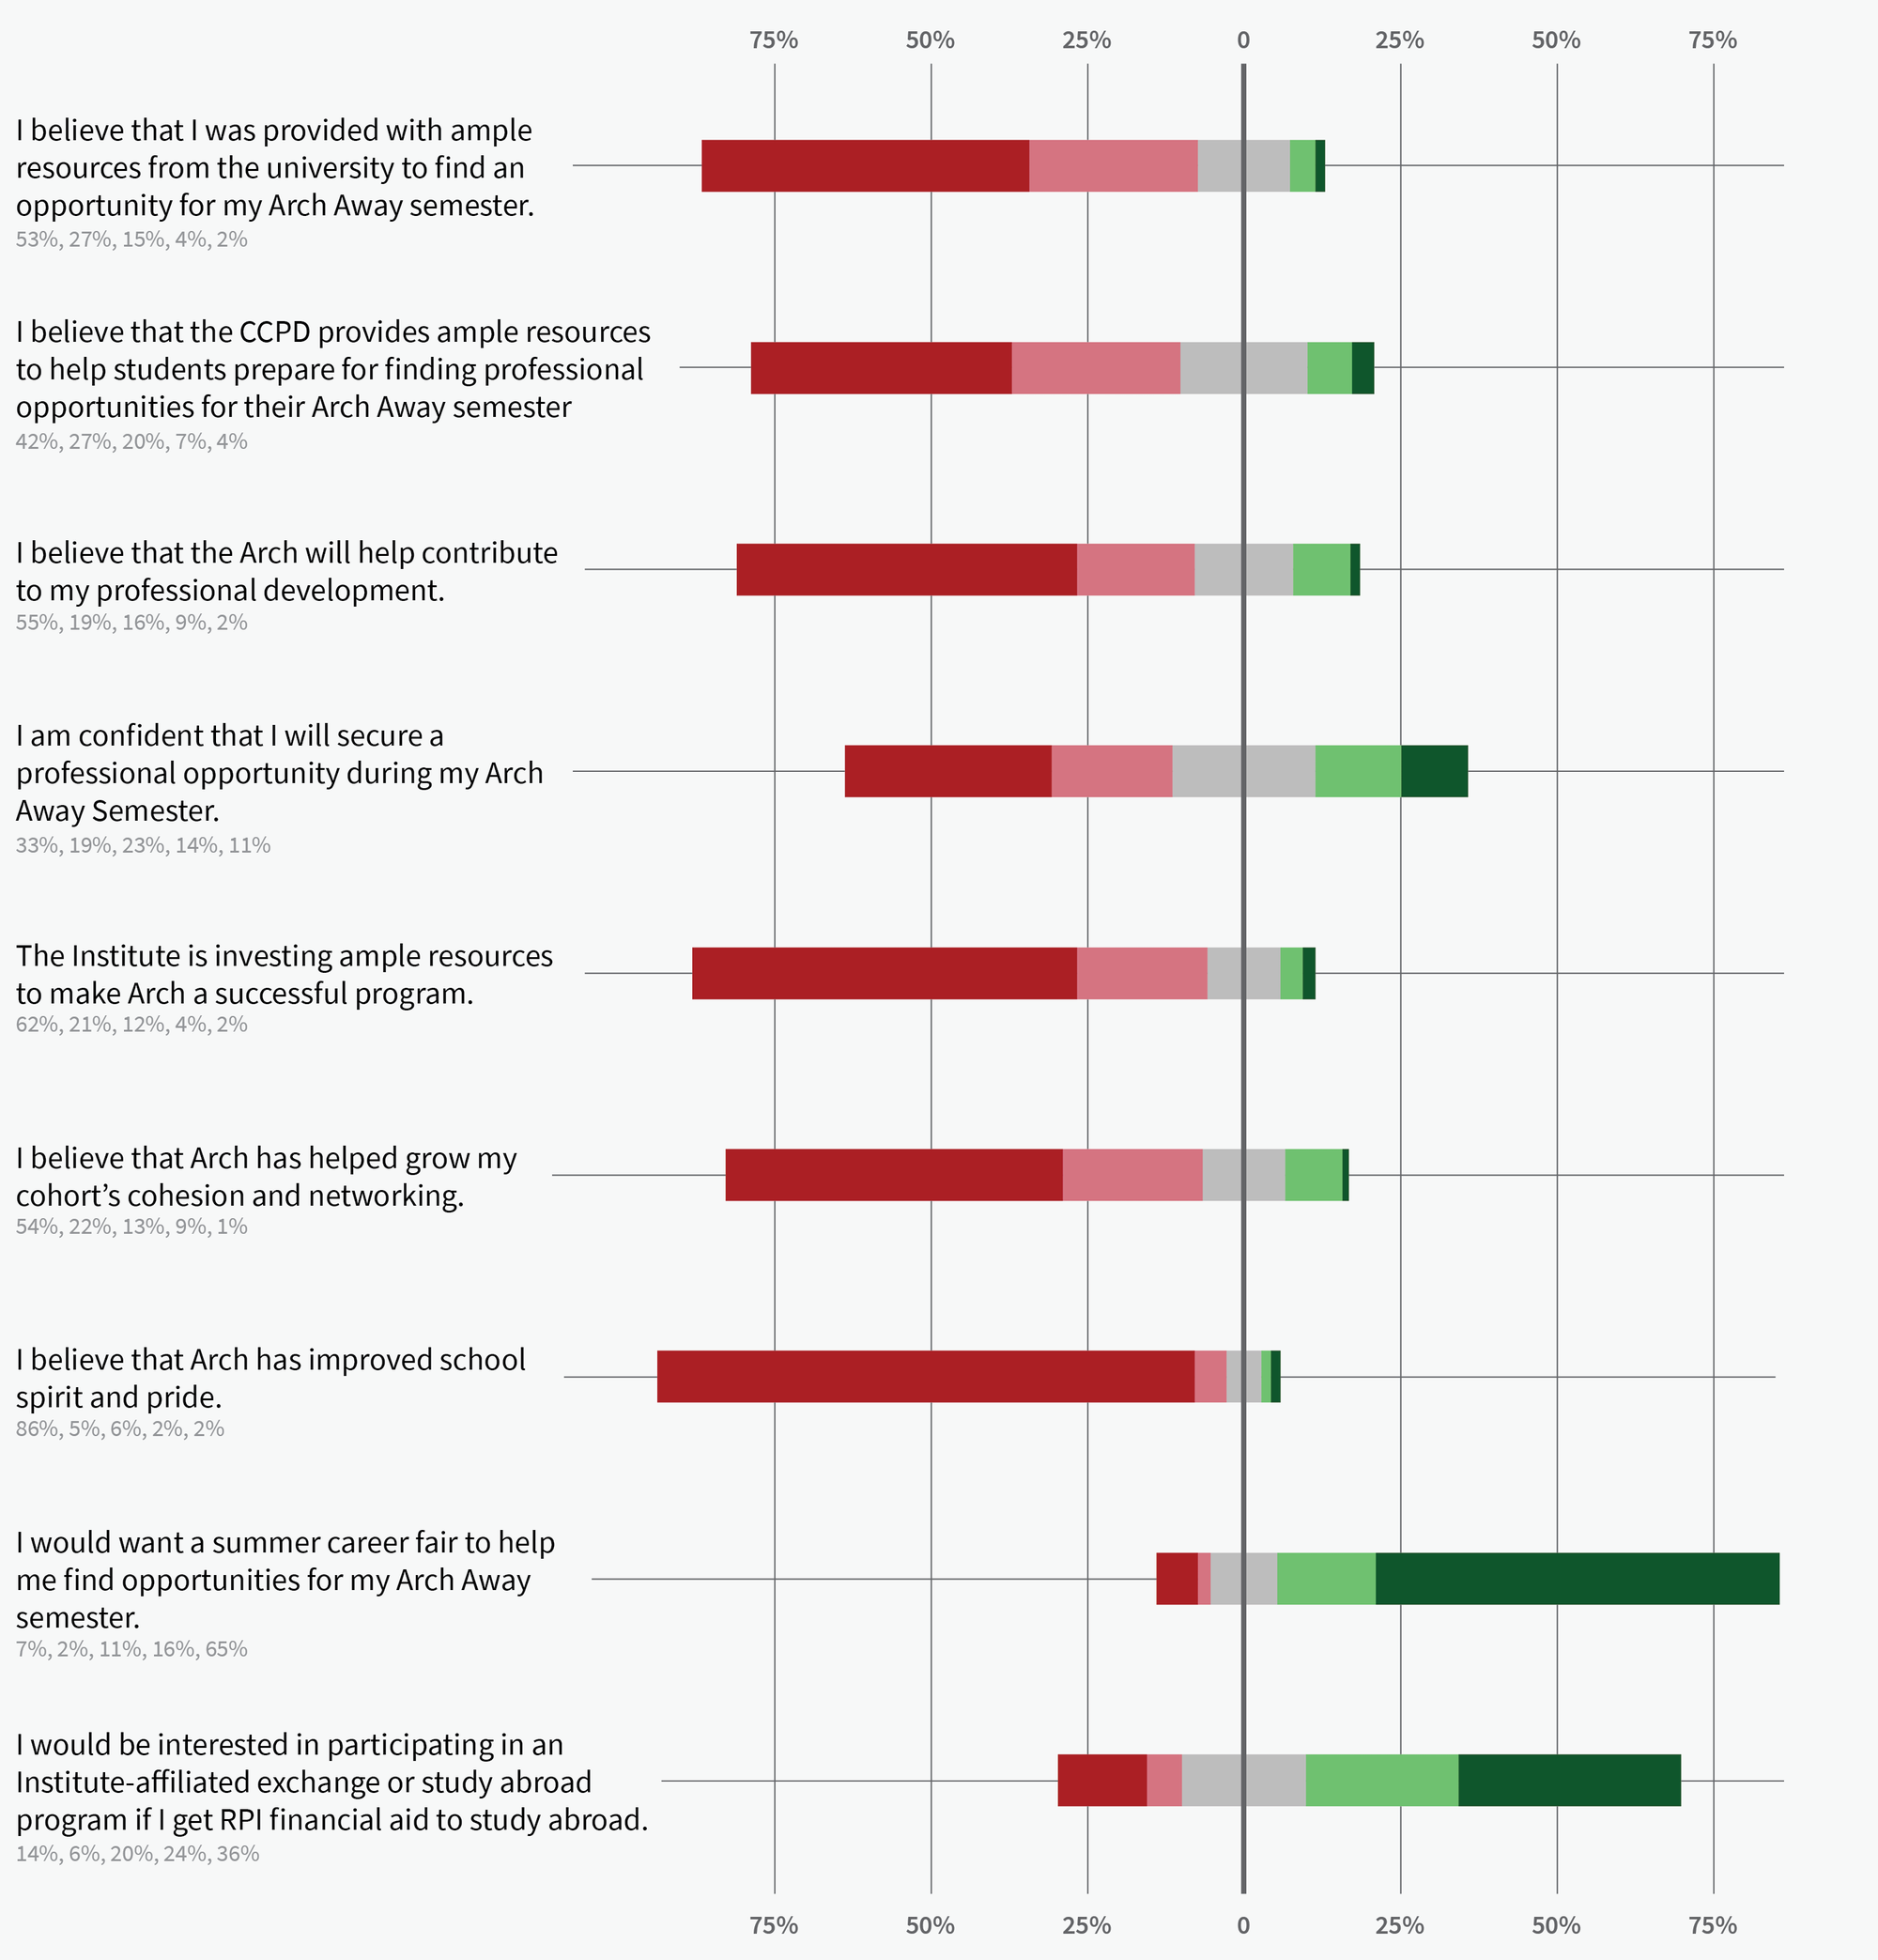
A full spreadsheet of the raw results, not including long-form responses, can be seen here.

 Town Meeting
 Student Senate
 Town Meeting
 Town Meeting