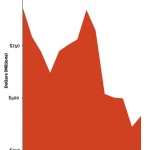
Net assets of RPI
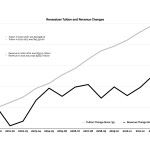
Tuition and revenue change
Net assets of all institutions
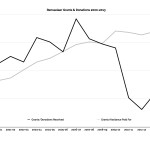
Grants and donations
Unrestricted net assets
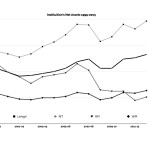
Tax-exempt bond liabilities
Since the turn of the new millennium, Rensselaer Polytechnic Institute has been changed through the implementation of President Shirley Ann Jackson’s The Rensselaer Plan. Under The Plan, major campus construction, such as the Experimental Media and Performing Arts Center, the Center for Biotechnology and Interdisciplinary Studies, and the East Campus Athletic Village, have been completed. Additionally, hundreds of new staff have been hired to work at the Institute, including researchers, administrators, and professors. Major changes like these have been implemented with the intention of bringing Rensselaer to further prominence in the higher education community. With these changes have come increased costs that had not been previously handled by the Institute. As it is registered as a non-profit organization, Rensselaer’s tax returns, in the form of Internal Revenue Service Form 990, are published each fiscal year and are required to be made available to the general public for inspection. This article will look to analyze trends in Rensselaer’s finances since 1999, and then compare them to those of similar research universities operating at a similar scale.
We have chosen three research universities with similar characteristics to RPI to be used in this analysis as benchmarks when comparing Rensselaer’s financial data. These universities are also non-profit organizations and must file their tax returns as Form 990. The schools we compared are Lehigh University, which is nearly identical to Rensselaer in terms of its operational budget; Rochester Institute of Technology, which operates on a slightly larger scale than RPI, and Worcester Polytechnic Institute, which operates on a smaller scale than RPI. All four of the institutions to be analyzed were founded in the 19th century. To give distinct reference points on the similarities of the universities, Rensselaer operated at a 13-year average total revenue of $374.7 million from 1999 to 2013. Comparatively, Lehigh operated at an average of $368.3 million, RIT operated at an average of $476.3 million, and WPI at an average of $170.5 million.
At the end of the 1999–2000 fiscal year, RPI had net assets which totaled $929.7 million. 13 years later, at the conclusion of the 2012–13 fiscal year, this number was $414.8 million, a decrease of 55 percent. Comparatively, in these 13 years, Lehigh, RIT, and WPI all increased their net assets, with changes of 42 percent, 25 percent, and 10 percent, respectively.
One cause for the loss of net assets may be that, according to our analysis, the Institute has ended nine out of the last 13 years with an operational deficit. In this analysis, operational surpluses or deficits are defined as the value in Part 1 of Form 990, on line 19 “Revenue Less Expenses” of the current form. The six most recent years had operational deficits leading up to the most recently reported deficit of fiscal year 2012–13, which was $18.1 million. Over these six years, the yearly deficit peaked at $83.2 million in 2010–11 and has totaled a loss of $253.6 million since the 2007–08 fiscal year. Before the streak of deficits, there had been a pattern of alternating sets of years with deficits and sets of years resulting in strong surpluses. Overall, from fiscal year 2000–01 through the most recently available data, Rensselaer brought in a total surplus of $15.2 million. Since fiscal year 2000–01, WPI has generated a similar total to RPI at $16.2 million. The same is not the case for RIT, whose operational surplus totals $174.5 million. Even further still, Lehigh University’s surplus totals $476.4 million. During these six years of consecutive deficits which have occurred at Rensselaer, WPI produced a total deficit of $3 million, while RIT and Lehigh generated net surpluses of $141.8 million and $216.5 million, respectively.
The newest, most expensive construction project that came to the Rensselaer campus in the 13 year period was EMPAC. It was originally announced on July 5, 2001, with a planned construction cost of $50 million and an expected opening date in Fall 2003. However, by the time ground was broken on the project in September of 2003, the revised construction cost became $141 million, and EMPAC was expected to be ready for opening in 2006. Neither of these plans were achieved, with EMPAC finally holding its grand opening in October 2008, with a reported cost that exceeded $200 million. The construction of EMPAC, along with the previously mentioned CBIS and ECAV, was planned to be funded by donations received through the Capital Campaign, which the Institute ran throughout the decade. Its total fundraising goal was $1 billion.
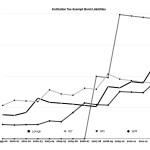
As a result of these multimillion dollar facilities being constructed, Rensselaer’s debt load began to increase as well. At the conclusion of fiscal year 1999–2000, the Institute’s total liabilities were $201.6 million, with the large majority of this made up by the $135.7 million in Mortgages and Other Notes Payable (1999–2000 Form 990, Part IV, Line 66b), which they held at the time. During that fiscal year, RPI had zero reported debt in the form of tax-exempt bonds. The first large spike in debt occurred in fiscal year 2001–02 with the Mortgages and Other Notes Payable value increasing to $321 million from the previous year’s $130.7 million. Next, in fiscal year 2005–06, the amount, which had remained fairly stable in the previous three years, jumped to $441.3 million. Starting in fiscal year 2007–08, the same year which EMPAC held its grand opening and the streak of operational deficits began, RPI began carrying tax-exempt bond liabilities along with the previous debt, which was now classified as Unsecured Notes and Loans Payable on the then-newly revised version of the Form 990. In the eight years since fiscal year 1999–2000, RPI’s total liabilities had reached $825.5 million, a 310 percent increase. A majority of this was made up of the new $249.3 million of tax-exempt bond debt, combined with the $396.6 million of unsecured notes and loans payable.
When Rensselaer first announced that they would be issuing bonds to help finance EMPAC, Vice President for Finance and Chief Financial Officer Virginia Gregg reported that the planned amount to be issued would be $160 million through 2007. Upon this announcement in February 2006, Moody’s Investors Service, a credit rating agency, dropped RPI’s bond rating from A1 to A2. The rating today is A3 with a negative outlook.
Two years after the initial bond debt, in fiscal year 2009–10, the tax-exempt bond liabilities nearly doubled, reaching a new total of $495.7 million. It appears that a large amount of the other debt held in the Form 990 category of Unsecured Notes and Loans Payable was issued in the form of additional bonds, as that entry was decreased to $273.6 million following the previous year’s $452.3 million. This tax-exempt bond debt is explained in detail in Schedule K for the Form 990s, entitled Supplemental Information on Tax Exempt Bonds. The bonds have been issued by two separate organizations: the City of Troy Capital Resource Corporation, which, as of the most recently available form, still holds $357 million in bonds, and the remainder, held by Rensselaer County Industrial Development Agency, totaling $64 million. All of the proceeds from these bonds are reported to have been spent. The City of Troy Capital Resource Corporation is directly affiliated with the city itself, and appears to, at this time, exist solely to manage the two sets of bonds it has issued for RPI. From its financial reports, it can be found that the corporation issued the first set of bonds in April of 2010 at a total issue price of $311.6 million and carrying a variable interest rate. As of December 31, 2013, none of these funds had been repaid. The bonds reach final maturation in September 2040. A second, smaller set of bonds were issued in June 2010, totaling $47.2 million. These have been paid down to a debt of $44.6 million, carry a set interest rate of three percent, and reach final maturation in September 2021. A further detailed financial report for the corporation can be found on the city’s website.
To gain further perspective on RPI’s debt load, total liabilities sit at $1.01 billion, as of the most recently available data, from FY 2012–13. Lehigh University holds total liabilities of $390.6 million, (57 percent of which are tax-exempt bonds), RIT’s total liabilities are $543.8 million, (55 percent of which are tax-exempt bonds), and WPI’s total liabilities are $308.4 million, (73 percent of which are tax-exempt bonds.)
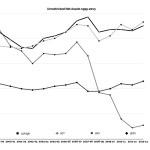
Because of Rensselaer’s increased debt load, throughout the decade, more and more of its net assets have become restricted. This means that the restricted portion of money is not available for everyday expenses, as it is withheld to cover outstanding liabilities. Since fiscal year 2010–11, the Institute’s unrestricted net assets have been negative—as of the most recently available data standing at (-)$89.7 million. This figure states that an organization is legally unable to spend their assets in any way of their choosing. Lehigh, RIT, and WPI each have unrestricted net assets of $733.6 million, $701.5 million, and $256.3 million, respectively, for fiscal year 2012–13.
Rensselaer consistently ranks as one of the top universities in the U.S. However, the rankings have remained fairly stagnant in the last several years, with the exception of the 2012 US News and World Report ranking which was 50th in the nation, the publication has given RPI a ranking of either 41 or 42 since 2008. For further historical data on RPI’s ranking, it held 39 in 1997 before fully dropping out of the top 50 in 2001. After returning to 49th in 2002, the Institute then gained a place or two each year before reaching 42nd in 2007.
In addition to top college rankings, Rensselaer also often ranks as having one of the highest tuitions. Ranking in at 17th on Business Insider’s most recent “America’s REAL Most Expensive Colleges” list. For the 2000–01 academic year, base tuition at RPI was $22,956. Over the next 12 years, tuition increased each successive year at an average of 4.99 percent, leading to a tuition of $43,350 for 2012–13. This is a total increase of 88.84 percent.
At any institution of higher education, tuition and fees for other services paid for by students make up a large portion of the organization’s revenue. From fiscal years 2000–01 to 2007–08, the average percentage revenue contribution for tuition and fees was 53 percent, with only a single year exceeding 60 percent. Since fiscal year 2008–09 to the present, the average is 66 percent, with all years exceeding 60 percent. This trend is in contrary to a Rensselaer Plan goal set out in May 2002, by Gregg. The implementation of The Plan, according to Gregg, would eventually allow for revenue at Rensselaer to be split into three equal sectors of 33 percent, representing tuition, research, and “all other revenue.” For some comparison, Lehigh’s tuition and fees contribution percentage hovers between 45 and 60 percent, while RIT’s runs between 50 and 65 percent, and WPI’s numbers have been varied over the 13–year analysis period, coming in as low as 46 percent and as high as 81 percent.
While tuition at all four institutions has increased at a fairly similar rate, the total revenue that RPI brought in has increased at a far slower rate than its own tuition has risen and when compared with the competitor schools. (For RPI, Lehigh, RIT, and WPI respectively, the 2000–01 tuitions were $22,956, $23,210, $18,252.00, and $23,262.00. While the 2012–13 tuitions were $43,350, $41,920, $32,784, and $41,380.) Total revenue has only increased 34.72 percent when comparing fiscal years 2012–13 with 1999–2000, but tuition has increased 88.84 percent in that same span. Lehigh’s increases for total revenue and tuition respectively are 80.61 percent and 55.02 percent, while RIT’s are 79.62 percent and 95.13 percent and finally WPI’s are 77.89 percent and 174.41 percent.
A large contributing factor for RPI’s slowed revenue growth—when compared to other institutions whose tuition and fee revenue has increased at a similar rate—is due to the sharp decrease in grants and donations received by RPI in recent years. For fiscal years 2000–01 to 2009–10, the average revenue from donations and grants was $114.6 million (with no year less than $89 million), or just under 30 percent of total revenue. However, since that time, for the last three available years, the average donation/grant revenue per year has been just $38.2 million. Even with this drop in revenue, the Institute has continued to pay out an average of $133.6 million in grants and assistance to others.
Of course, Rensselaer has gone through the previously mentioned expansion during the period for which finances have been analyzed. Lehigh University also went through a period of growth on its campus at the very end of the 1990s, with two multimillion dollar projects in the form of a large performing arts center and sports complex, both meeting campus needs akin to EMPAC and ECAV. These projects were completed around 1999, so theoretically, RPI would be at a similar state now as Lehigh may have been in about 2004 or 2005.
The Poly reached out to members of the Institute’s administration for a statement on RPI’s financial strategies in recent years. In response, Vice President of Strategic Communications and External Relations David Brond provided: “We have balanced the operating budget, every year, for the past 15 years, and made strategic investments that have enhanced the university and which have resulted in a tripling of applications. We continue to attract very bright students, with excellent prospects when they graduate. We have transformed the student experience; built world class platforms; tripled research; hired 320 new faculty; and elevated university rankings. We have withstood, and managed through two major dislocations in the economy during this time frame; the tech bubble burst and a financial crisis. We are proud of what we have accomplished.”
To conclude this analysis, we will review the facts presented. In the years since 1999, Rensselaer Polytechnic Institute has decreased its total net assets by 55 percent, due to taking on nearly $1 billion in new liabilities. Beyond this, the complete amount and then more of the Institute’s current net assets have been fully restricted, disallowing them from being spent. Direct reasons for these changes stem from six consecutive years of operational deficits, the issuance of nearly $500 million in tax-exempt bonds to cover costs on new campus constructions, and a steep decrease in the yearly revenue made up by grants and donations coming into Rensselaer. It is important to remember, however, that the increased spending has brought world-class facilities and educational services to RPI. All of this has occurred while tuition has continued to increase at a steady rate, leading to a rise in percentage contribution of tuition to RPI’s total revenue. Three competitor universities, Lehigh, RIT, and WPI, have been used as reference points on Rensselaer’s performance, with all of these institutions appearing to have statistically stronger performance in the years that have been analyzed. It remains to be seen if these trends will continue into future years. The data for fiscal year 2013–14 will become available in the coming months.
Editor’s Notes:
All values used in this article are rounded for enhanced comprehension.
All monetary figures in this article are stated in the dollar value of the year in which they were reported to the IRS.
All IRS Form 990(s) which were used to compile this article are available through ProPublica. RPI IRS Form 990(s) are available at http://poly.rpi.edu/s/rpi990